IBM Capstone Project
SpaceX - Data Wrangling
This is the capstone project required to get the IBM Data Science Professional Certificate. Yan Luo, a data scientist and developer, and Joseph Santarcangelo, both data scientists at IBM, directed the project. The project will be presented in seven sections, and the lecture Jupyter notebooks and tutorials were used to compile the contents.
As a data scientist, I was tasked with forecasting if the first stage of the SpaceX Falcon 9 rocket will land successfully, so that a rival firm might submit better informed bids for a rocket launch against SpaceX. On its website, SpaceX promotes Falcon 9 rocket launches for 62 million dollars, whereas other companies charge upwards of 165 million dollars. A significant portion of the savings is attributable to SpaceX's ability to reuse the first stage. If we can determine whether the first stage will land, we can calculate the launch cost. This information might be useful if an alternative company want to compete with SpaceX for a rocket launch. In this project, I will conduct data science methodology including business understanding, data collection, data wrangling, exploratory data analysis, data visualization, model development, model evaluation, and stakeholder reporting.
Exploratory data analysis (EDA) is the focus of the IBM Capsone Project's third phase, in which we will look for patterns in the data and decide which variables will serve as labels for training supervised models. There are multiple instances in the dataset where the booster did not safely land. When a mission ends with True Ocean, it implies the spacecraft successfully landed in that area of the ocean; when it ends with False Ocean, it means the landing attempt was aborted for some reason. If the RTLS is true, the mission was completed with a safe landing on the ground. If the RTLS is false, the landing attempt on the ground pad failed. True ASDS indicates that the mission result was safely delivered to a drone ship. A false ASDS indicates that the mission result could not be safely transferred to a drone ship. None ASDS and None None these represent a failure to land. Here, we focus on translating those results into Training Labels, where 1 indicates a successful booster landing and 0 indicates a failed one.
Importing the two primary data manipulation libraries of the Python programming language is the first step.
import pandas as pd
import numpy as np
Then, the Space X dataset from the previous part is imported.
df=pd.read_csv("https://cf-courses-data.s3.us.cloud-object-storage.appdomain.cloud/IBM-DS0321EN-SkillsNetwork/datasets/dataset_part_1.csv")
df.head(10)
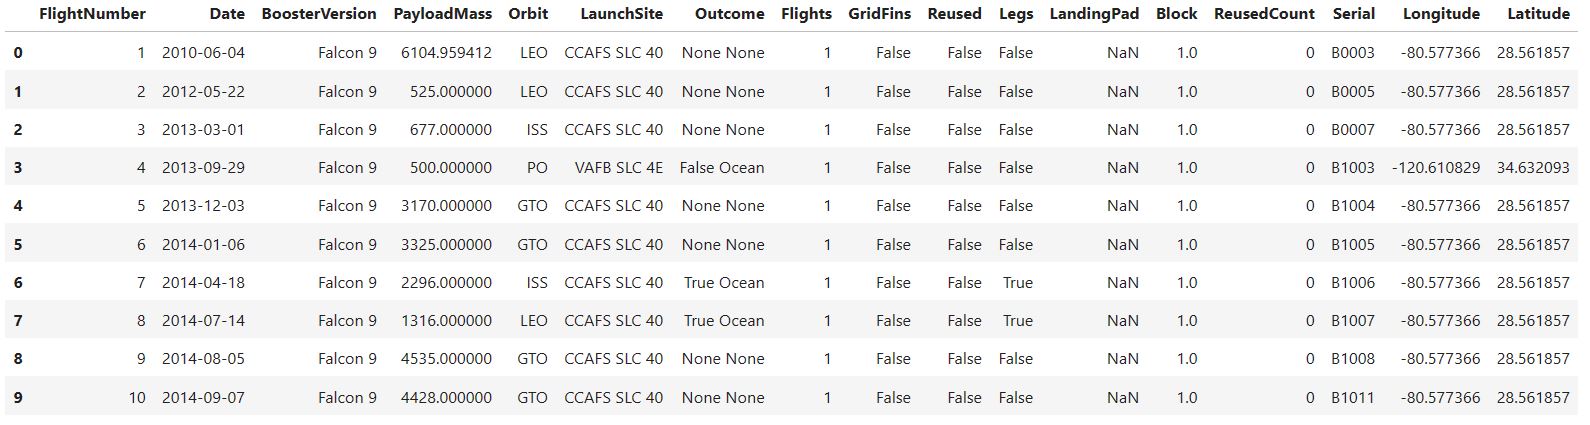
The next step is to identify and calculate the percentage of the missing values in each attribute by using the following syntax.
df.isnull().sum()/df.count()*100
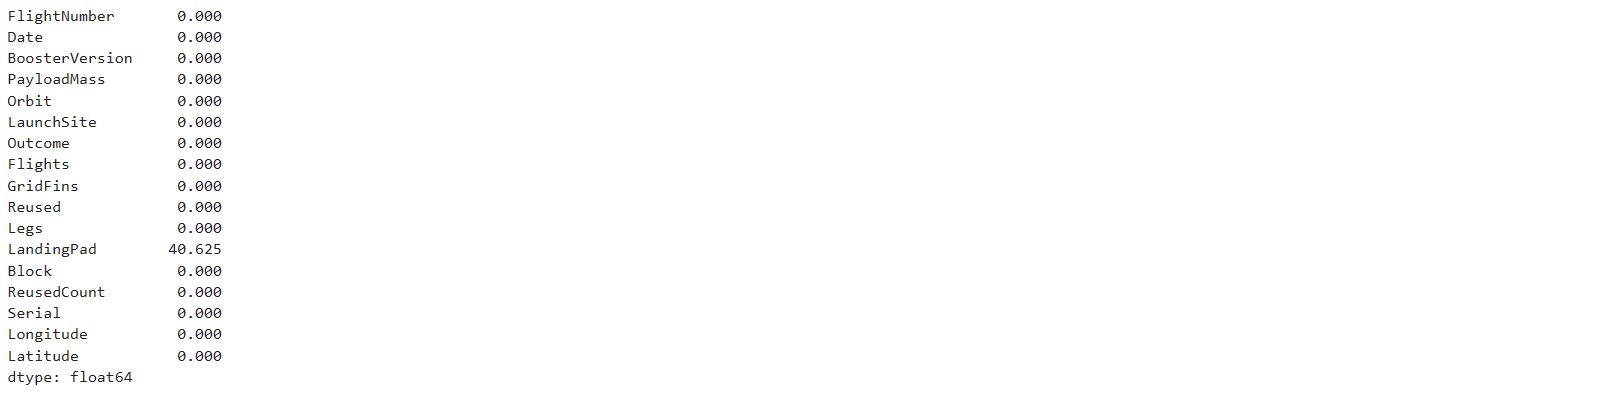
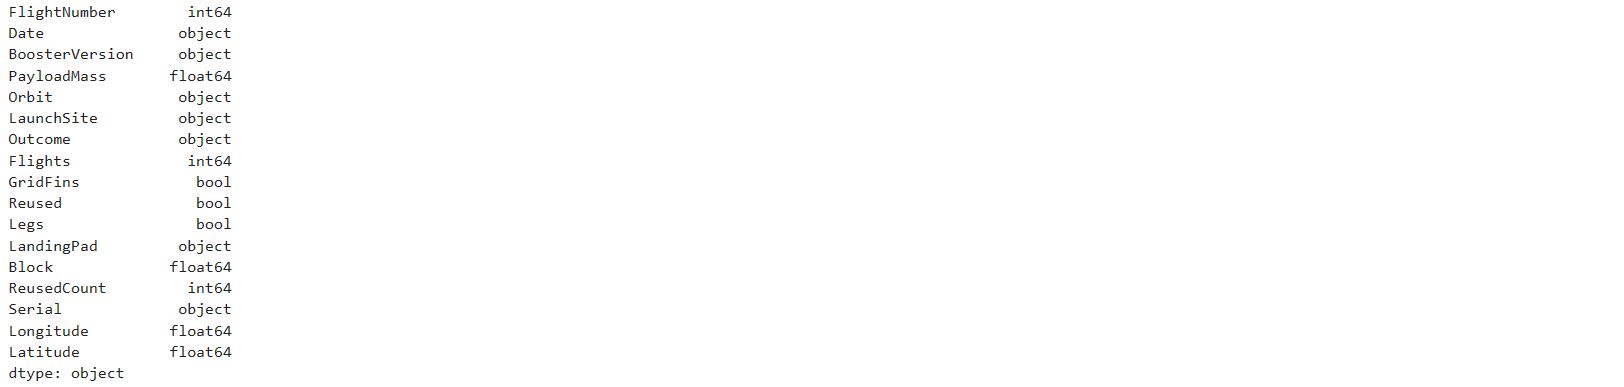
The data for 40.625% of LandingPad column is missing. We then determine which columns are numerical and which are categorical. We can determine that boolean data types are categorical data from the image below.
After that, we need to figure out how many launches occurred at each site. Several Space X launch sites are included in the dataset, including Cape Canaveral Space Launch Complex 40 VAFB SLC 4E , Vandenberg Air Force Base Space Launch Complex 4E (SLC-4E), and Kennedy Space Center Launch Complex 39A KSC LC 39A . The location of each Launch Is placed in the column LaunchSite. We can use the method value_counts() on the column LaunchSite to determine the number of launches on each site.
df["LaunchSite"].value_counts()

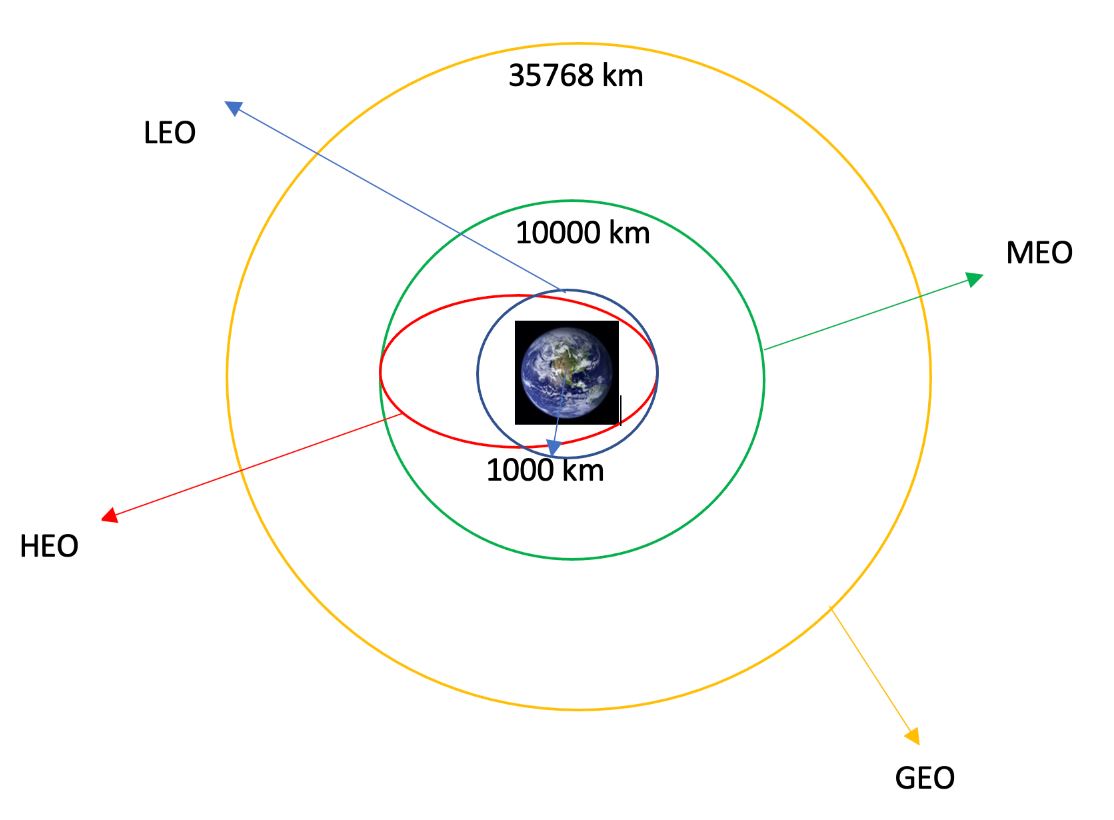
Every launch is sent into orbit with a specific goal in mind; below are some common orbit types:
- An LEO orbit is one that is less than 2,000 kilometers above the surface of the planet.
- The average altitude of orbits below 450 kilometers is used to define Very Low Earth Orbits (VLEO).
- Satellites can stay in sync with Earth's rotation when they are in geosynchronous orbit, also known as GTO. This position, 35,786 kilometers above Earth's equator, is ideal for weather, communications, and surveillance monitoring.
- A sun-synchronous orbit, or SSO for short, is also known as a heliosynchronous orbit, and it is almost polar in that the satellite always crosses the same spot on Earth at the same local mean solar time.
- When ES-L1 is located at one of the Lagrange points, the mutual gravitational attraction between the two massive masses is balanced by the smaller mass's orbital motion around the larger bodies' centers of mass.
- Often, when people talk about orbits around Earth, they're referring about those that are extremely elliptical, or HEOs.
- The International Space Station (ISS) is a modular habitat satellite in low Earth orbit.
- The altitude of MEO geocentric orbits varies from 2,000 to 35,786 kilometers
- HEO orbits are geocentric trajectories that exceed 30,786 miles in al (35,786 km).
- A geosynchronous orbit (GEO) is a circular path that stays in sync with Earth's rotation at a height of 35,786 kilometers above the equator.
- One sort of satellite orbit is called a polar orbit (PO), in which the satellite flies directly over both poles of the planet.
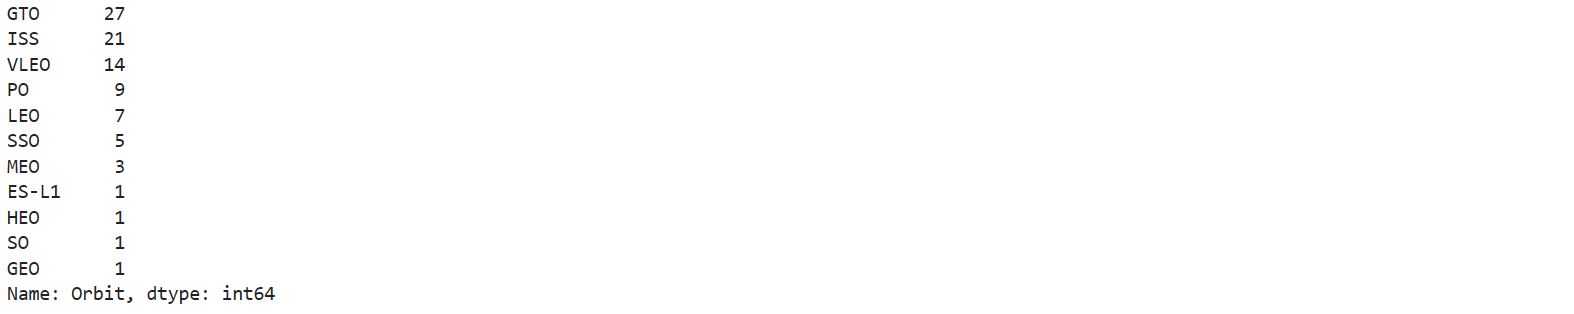
It is possible to count the occurrences of each orbit in the Orbit column by using the .value_counts() method.
df["Orbit"].value_counts()
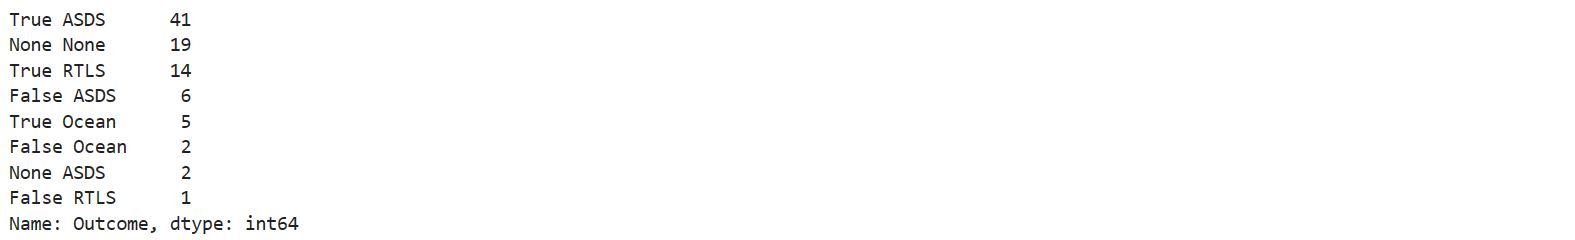
We then determine the number and frequency of mission outcomes for each orbit type. The number of landing outcomes is determined by applying the method .value counts() to the column Outcome. The data is then stored in a variable named landing_outcomes.
landing_outcomes=df["Outcome"].value_counts()
landing_outcomes
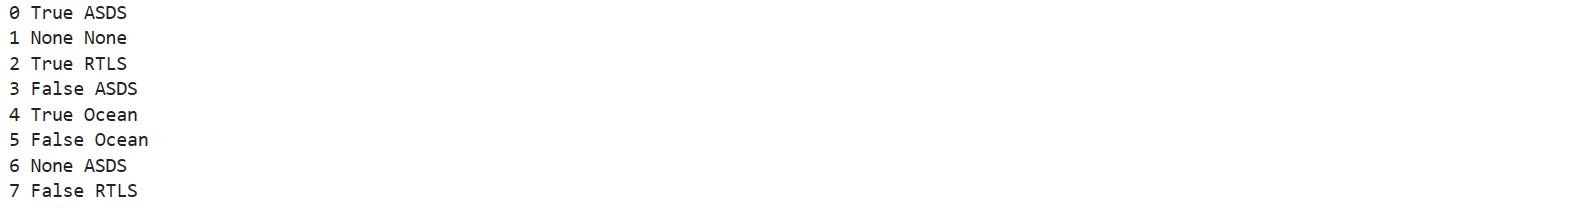
We can use the built-in enumerate() function to loop over the outcomes and have their counter number iterate them in a loop.
for i,outcome in enumerate(landing_outcomes.keys()):
	print(i,outcome)
Now, we can define a set object with the outcome keys and create a landing outcome label from the Outcome column based on mission failure.
bad_outcomes=set(landing_outcomes.keys()[[1,3,5,6,7]])
bad_outcomes

A list based on the values in the Outcome column can be generated where each element is zero if the corresponding outcome is part of the set bad outcome, and one otherwise. Then we can store it in the landing_class variable. The results of each launch will be represented by this classification variable. A number of 0 indicates that the first stage did not land successfully, whereas a value of 1 indicates that it did.
landing_class = []
for key, value in df['Outcome'].items():
	if value in bad_outcomes:
		landing_class.append(0)
	else:
		landing_class.append(1)

df['Class']=landing_class
df[['Class']].head(8)
The image below shows the first ten rows of the resultant dataframe.
df.head(10)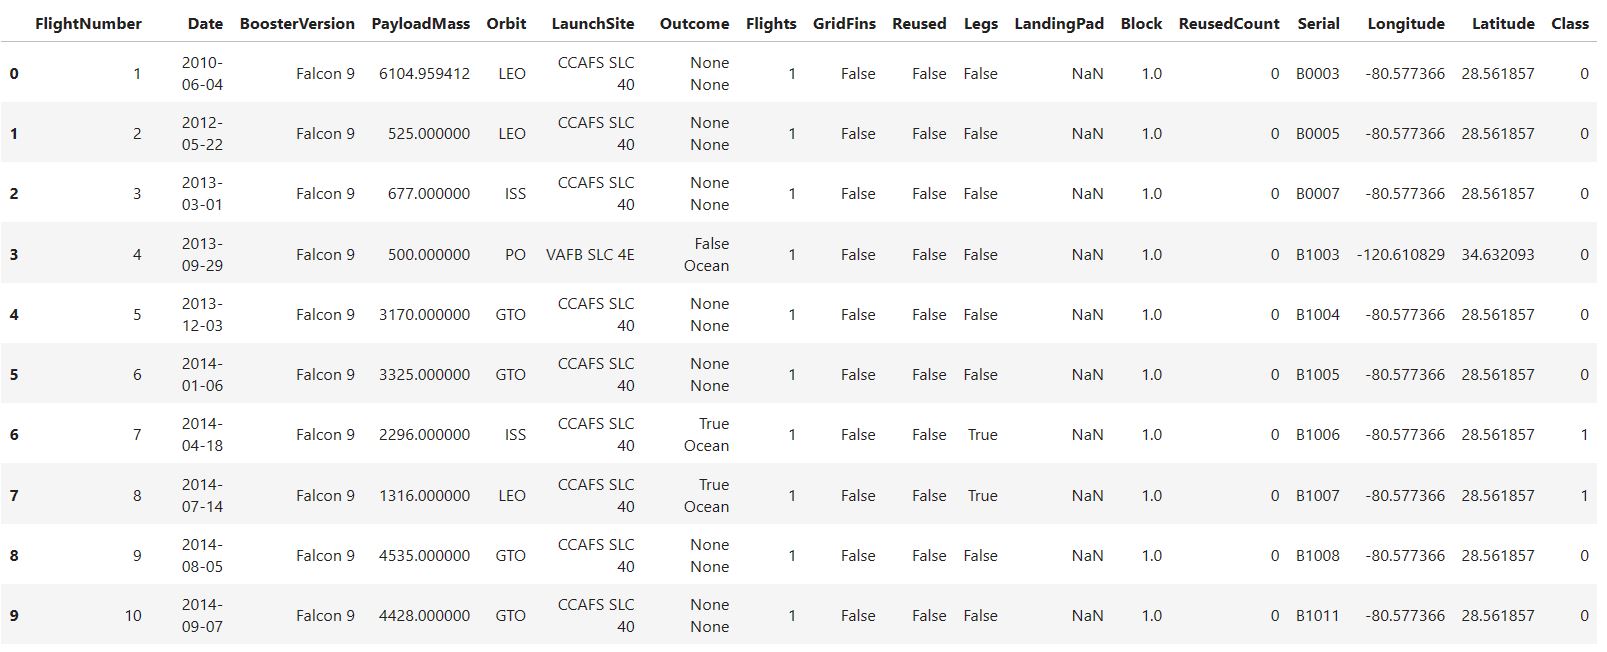
With the following line of code, we can calculate the percentage of success.
df["Class"].mean()
At this point, we can move on to the next section by exporting it as a CSV.
df.to_csv("dataset_part_2.csv", index=False)