IBM Capstone Project
SpaceX - Interactive Visual Analytics with Folium
This is the capstone project required to get the IBM Data Science Professional Certificate. Yan Luo, a data scientist and developer, and Joseph Santarcangelo, both data scientists at IBM, directed the project. The project will be presented in seven sections, and the lecture Jupyter notebooks and tutorials were used to compile the contents.
As a data scientist, I was tasked with forecasting if the first stage of the SpaceX Falcon 9 rocket will land successfully, so that a rival firm might submit better informed bids for a rocket launch against SpaceX. On its website, SpaceX promotes Falcon 9 rocket launches for 62 million dollars, whereas other companies charge upwards of 165 million dollars. A significant portion of the savings is attributable to SpaceX's ability to reuse the first stage. If we can determine whether the first stage will land, we can calculate the launch cost. This information might be useful if an alternative company want to compete with SpaceX for a rocket launch. In this project, I will conduct data science methodology including business understanding, data collection, data wrangling, exploratory data analysis, data visualization, model development, model evaluation, and stakeholder reporting.
There are a number of variables that could affect the launch success rate, including payload mass, orbit type, and more. Launch site proximity and location may also have a role in determining rocket trajectories' beginning positions. Existing launch site locations can potentially shed light on some of the criteria involved in finding an appropriate location for developing a launch site. In the preceding section, we performed some first exploratory data analysis on the SpaceX launch dataset by visualizing it with'matplotlib' and'seaborn,' and found some preliminary connections between the launch site and success rates. In this phase, we will use 'Folium' to conduct more interactive visual analytics.
This section details how to plot launch sites on a map, how to determine whether or not a given site has been used for a successful launch, and how to determine the location of nearby points of interest. By achieving the aforementioned goals, we should be able to identify regional tendencies among potential launch locations.
We start by importing the necessary Python package for this part.
!pip install folium
Next, we import Pandas, Folium, and its required plug-ins in order to utilize the package's mouse location, marker, and icon attributes.
import pandas as pd
import folium
from folium.plugins import MarkerCluster
from folium.plugins import MousePosition
from folium.features import DivIcon
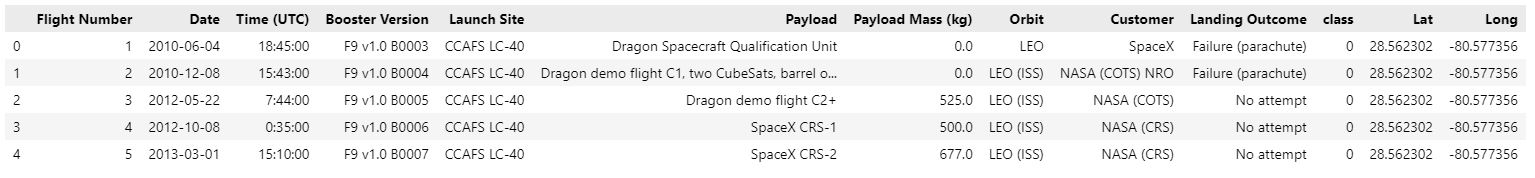
The initial step is to plot the sites' latitude and longitude on a map. The following spacex launch geo.csv' file is an enhanced dataset in which latitude and longitude coordinates have been included to each site.
URL = 'https://cf-courses-data.s3.us.cloud-object-storage.appdomain.cloud/IBM-DS0321EN-SkillsNetwork/datasets/spacex_launch_geo.csv'
spacex_df=pd.read_csv(URL)
spacex_df.head()
Once the dataset has been imported, we can check out where exactly each location is located.
spacex_df = spacex_df[['Launch Site', 'Lat', 'Long', 'class']]
launch_sites_df = spacex_df.groupby(['Launch Site'], as_index=False).first()
launch_sites_df = launch_sites_df[['Launch Site', 'Lat', 'Long']]
launch_sites_df

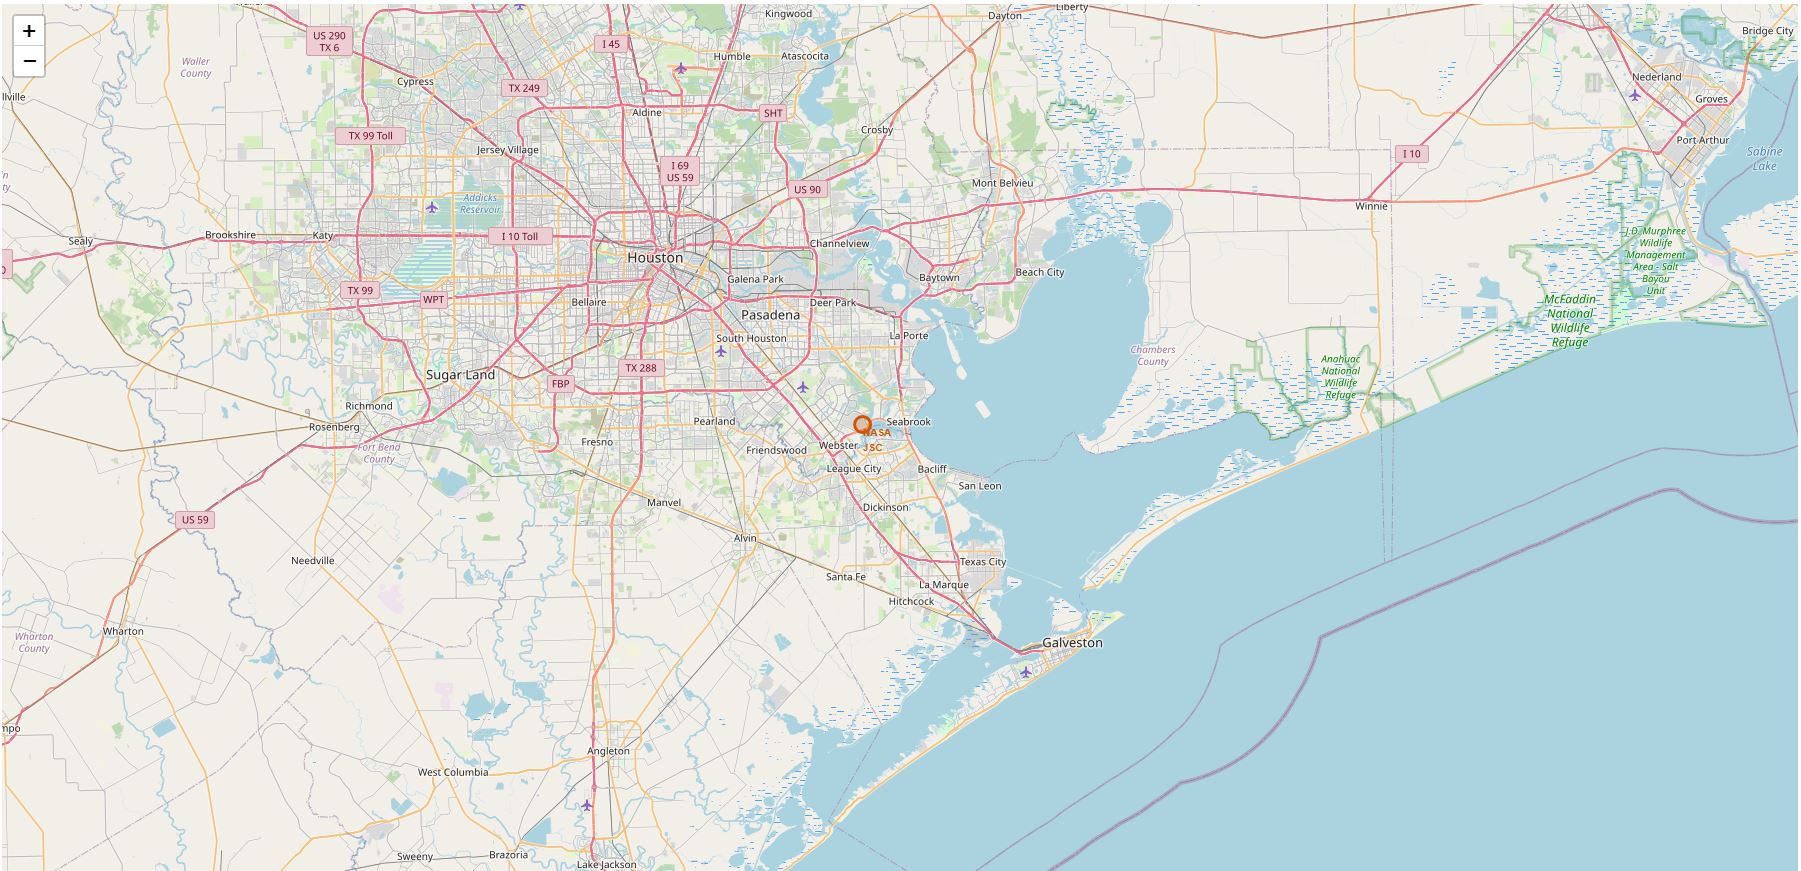
Without additional information, the above coordinates mean nothing in terms of addressing the exact location of the launch pads. To better understand their locations, we have marked them on a map with markers. To begin, a folium 'Map' object must be made with the NASA Johnson Space Center in Houston, Texas as its initial center. Using the 'folium.Circle' function, we can place a highlighted circular area labeled with text at a certain coordinate, drawing attention to NASA's location on the map.To begin, a folium 'Map' object must be made with the NASA Johnson Space Center in Houston, Texas as its initial center. Using the 'folium.Circle' function, we can place a highlighted circular area labeled with text at a certain coordinate, drawing attention to NASA's location on the map.
nasa_coordinate = [29.559684888503615, -95.0830971930759]
site_map = folium.Map(location=nasa_coordinate, zoom_start=10)

circle = folium.Circle(nasa_coordinate, radius=1000, color='#d35400', fill=True).add_child(folium.Popup('NASA Johnson Space Center'))

marker = folium.map.Marker(nasa_coordinate,icon=DivIcon(icon_size=(20,20),icon_anchor=(0,0),html='divtag style="font-size: 12; color:#d35400;" btag %s btag divtag'% 'NASA JSC'))
# Due to the inability to insert HTML code in an HTML file, I wrote tags as statements.

site_map.add_child(circle)
site_map.add_child(marker)
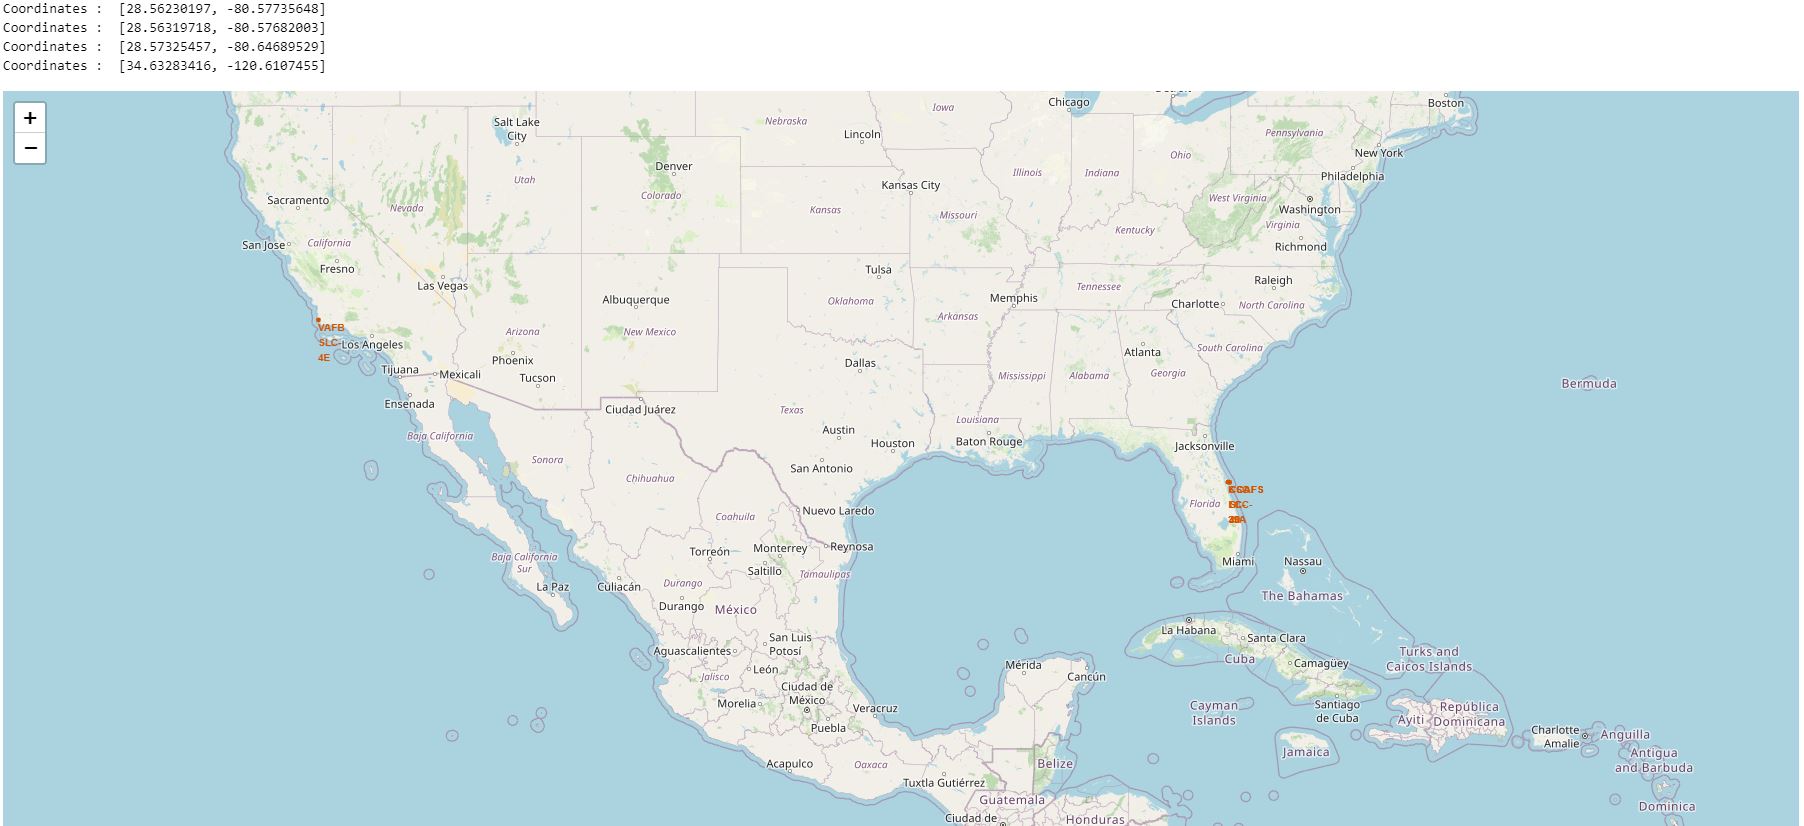
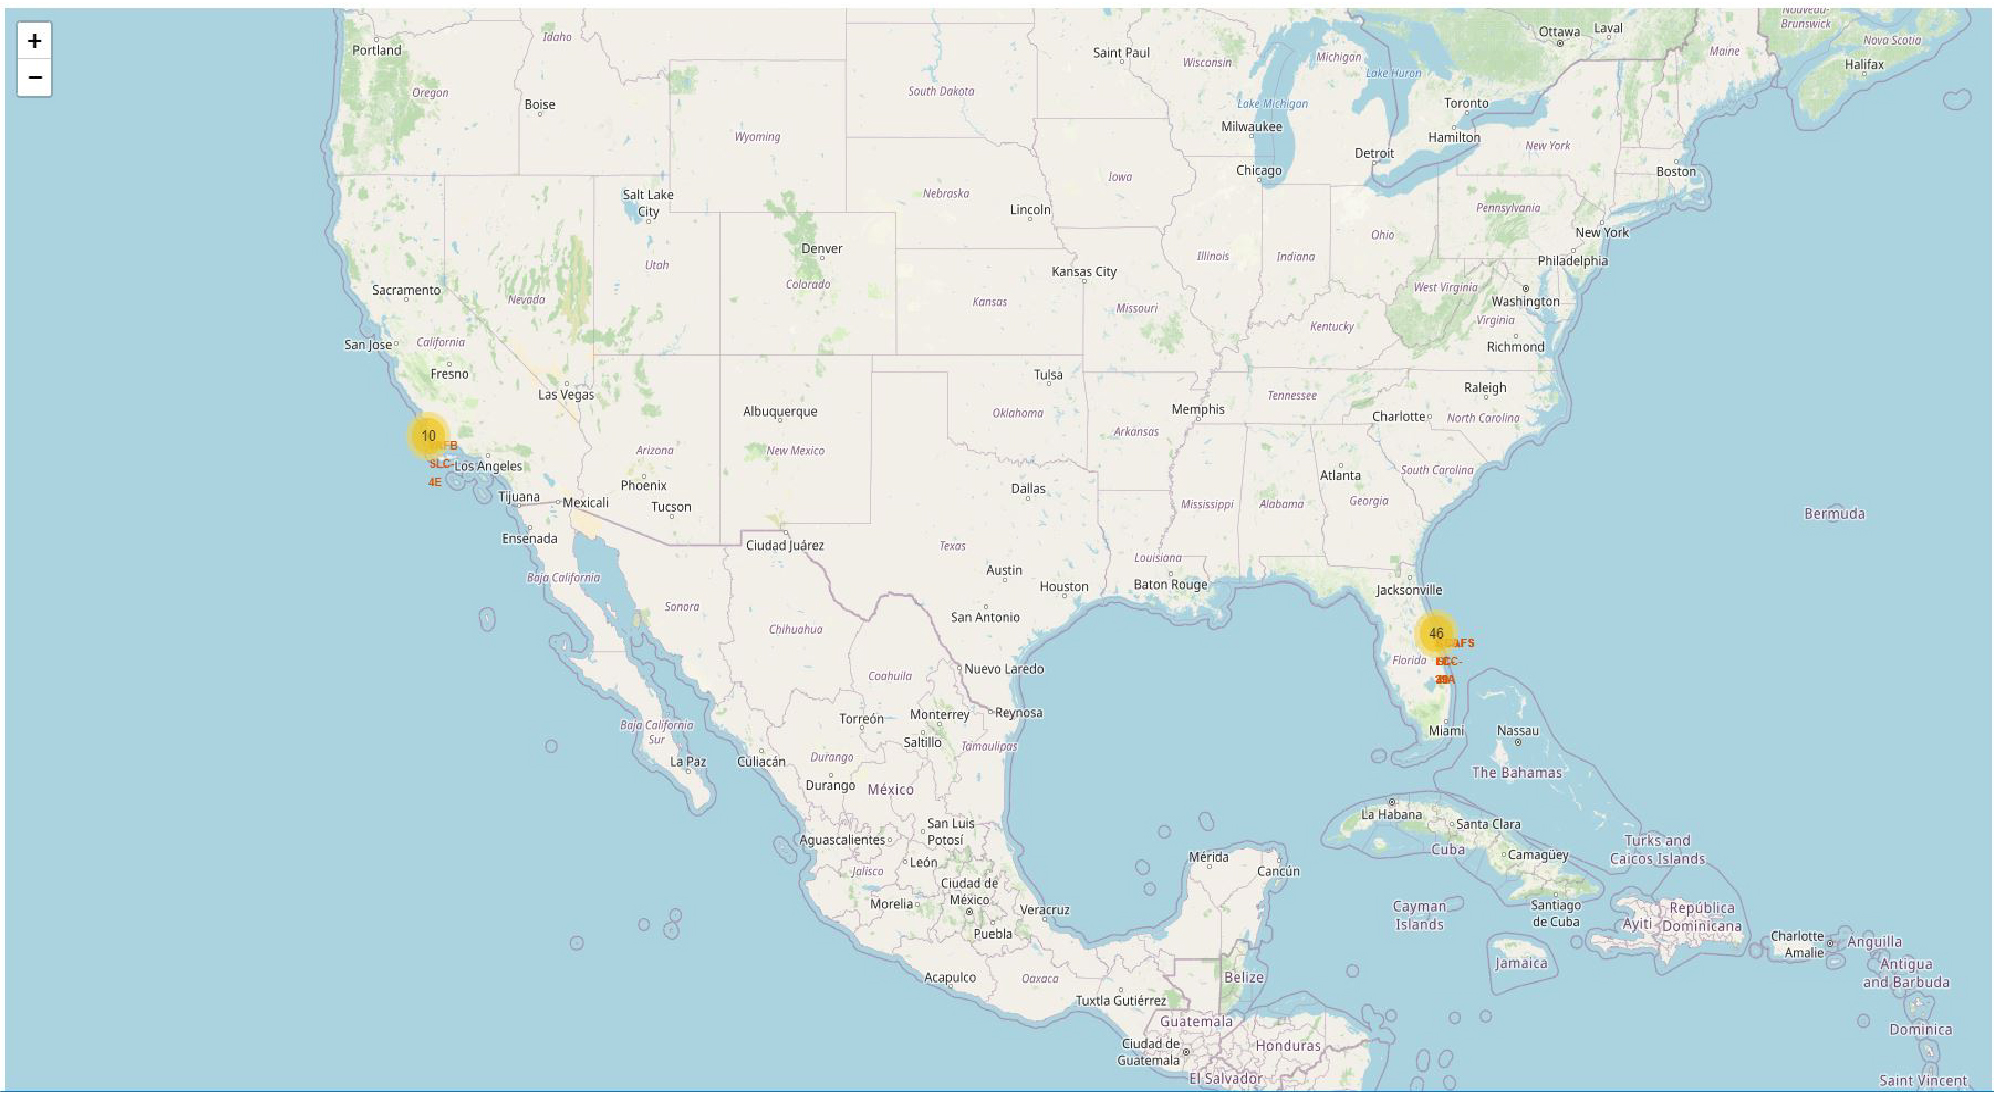
Then, we construct and append 'folium.Circle' and 'folium.map.Marker'to the map for each launch site.
site_map = folium.Map(location=nasa_coordinate, zoom_start=5)

def create_point_coordinates(df):
	coordinate = [df['Lat'], df['Long']]
	print('Coordinates : ',coordinate)

	circle = folium.Circle(coordinate, radius=100, color='#d35400', fill=True).add_child(folium.Popup(df['Launch Site']))

	marker = folium.map.Marker(coordinate, icon=DivIcon(icon_size=(20,20), icon_anchor=(0,0),
			html='divtag style="font-size: 12; color:#d35400;"> btag %s btag divtag' % df['Launch Site']))
			# Due to the inability to insert HTML code in an HTML file, I wrote tags as statements.

	site_map.add_child(circle)
	site_map.add_child(marker)

launch_sites_df.apply(lambda df : create_point_coordinates(df), axis = 1)
site_map
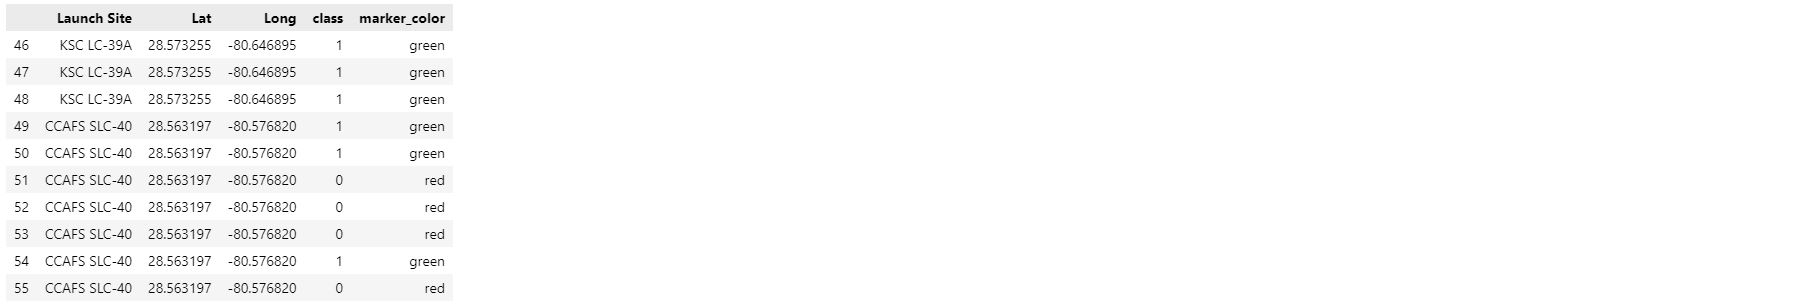
The launch results for each site should be added to the map next so we can determine which sites are the most successful. The 'class' column in spacex df, which we remember contains detailed launch records, informs us whether or not the launch was successful. We use a green marker if the launch was successful "(class=1)," and a red marker if it was unsuccessful "(class=0").
To begin, a new column named "marker_color" must be added to the "launch_sites" dataframe to keep track of the marker colors according to the "class" value.
def assign_marker_color(launch_class):
    if launch_class == 1:
        return 'green'
    else:
        return 'red'

spacex_df['marker_color'] = spacex_df['class'].apply(assign_marker_color)
spacex_df.tail(10)
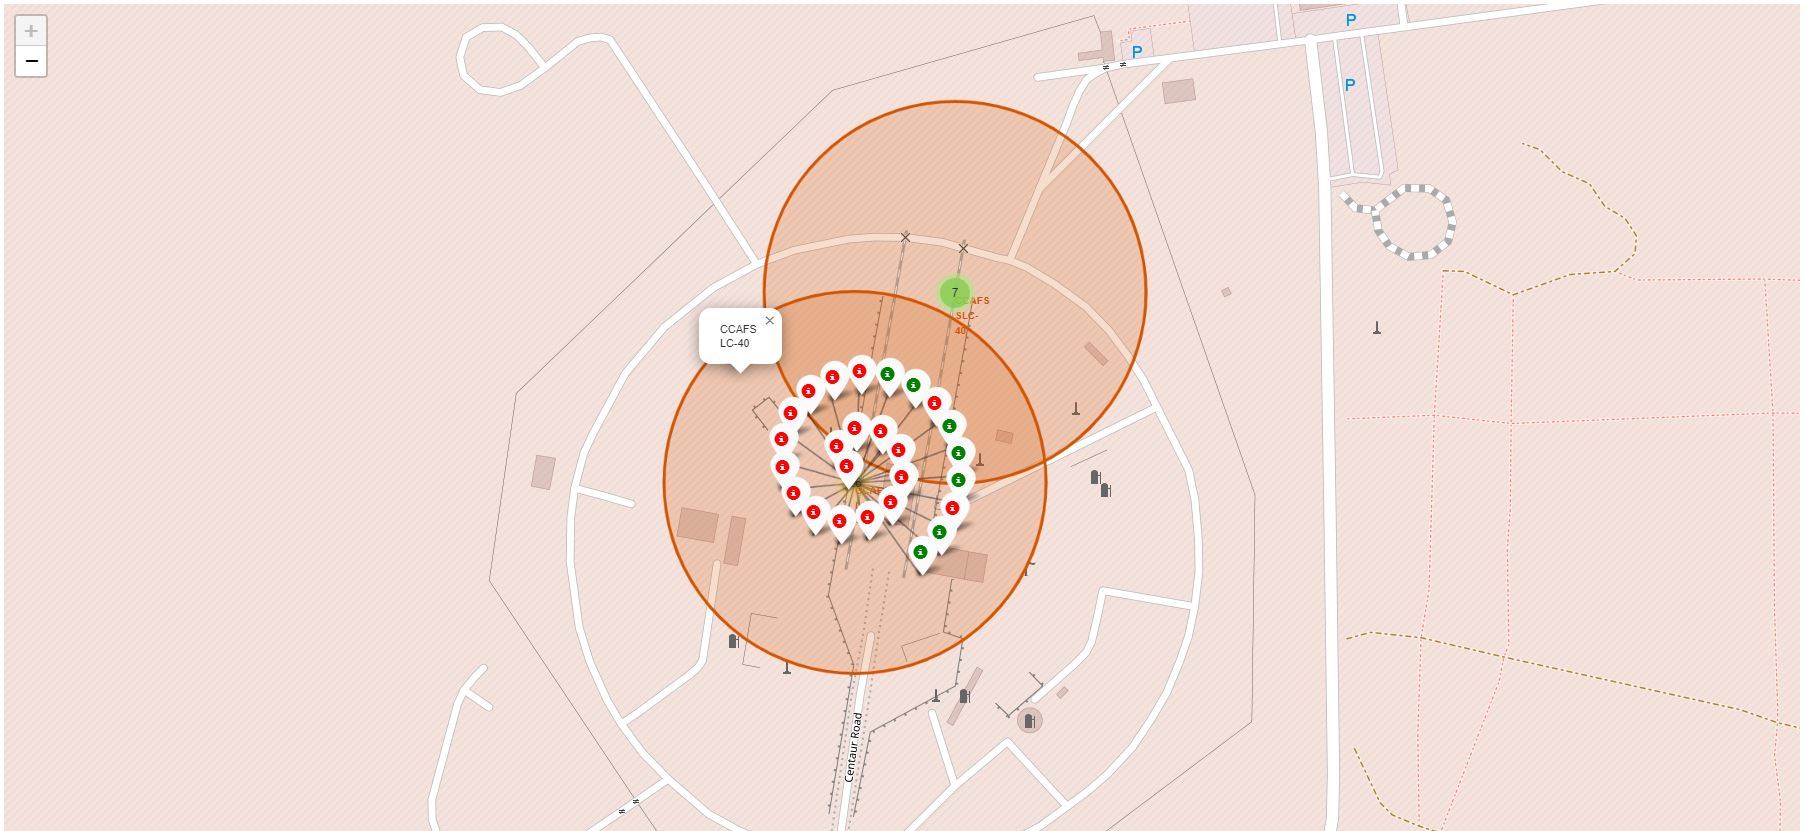
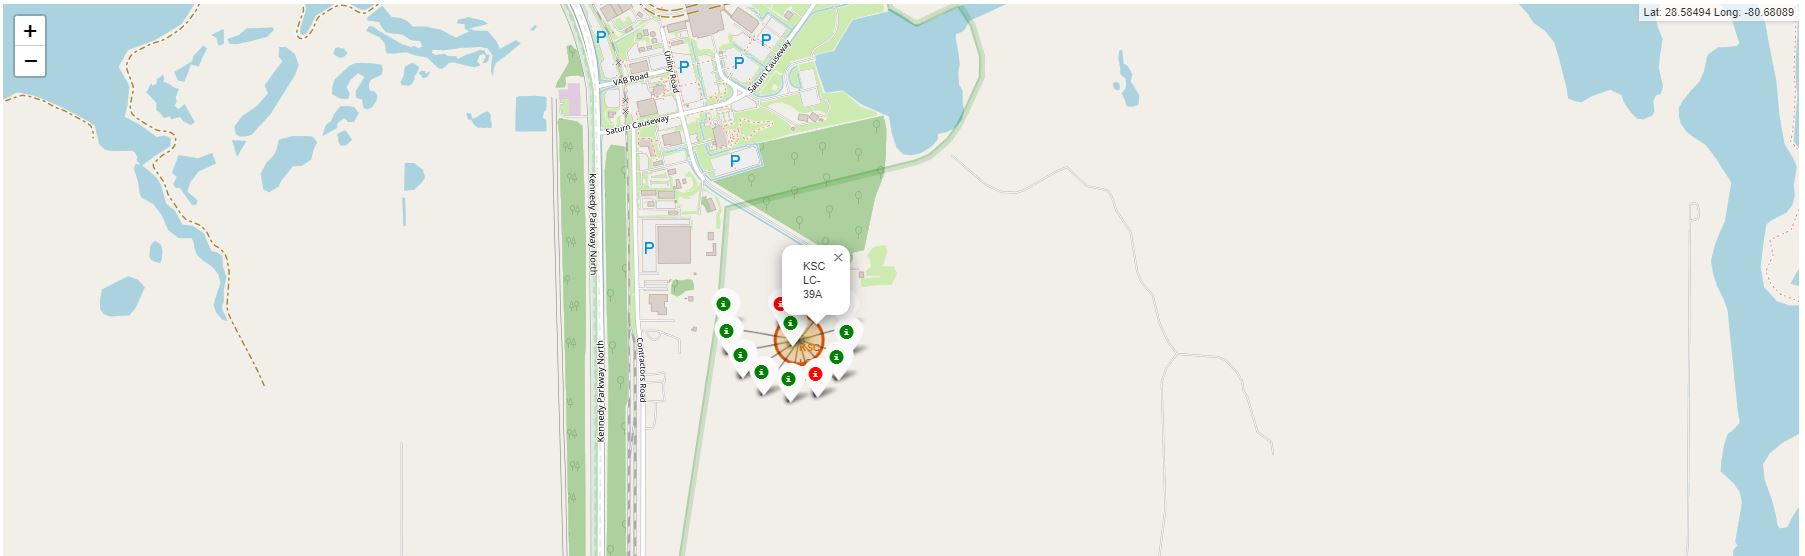
The next step is to add a "MarkerCluster" object to the current map and assign it a variable. The next step is to define marker objects for each row in the spacex_df dataframe, and then to adjust the icon properties of each marker to reflect the success or failure of a launch.
marker_cluster = MarkerCluster()

site_map.add_child(marker_cluster)

for index, row in spacex_df.iterrows():
	marker = folium.Marker([row['Lat'], row['Long']],icon=folium.Icon(color='white', icon_color=row['marker_color']))
	marker_cluster.add_child(marker)

site_map
If we zoom in on the map, the clusters of marks that share a color will reveal which launch sites have better than average success rates.
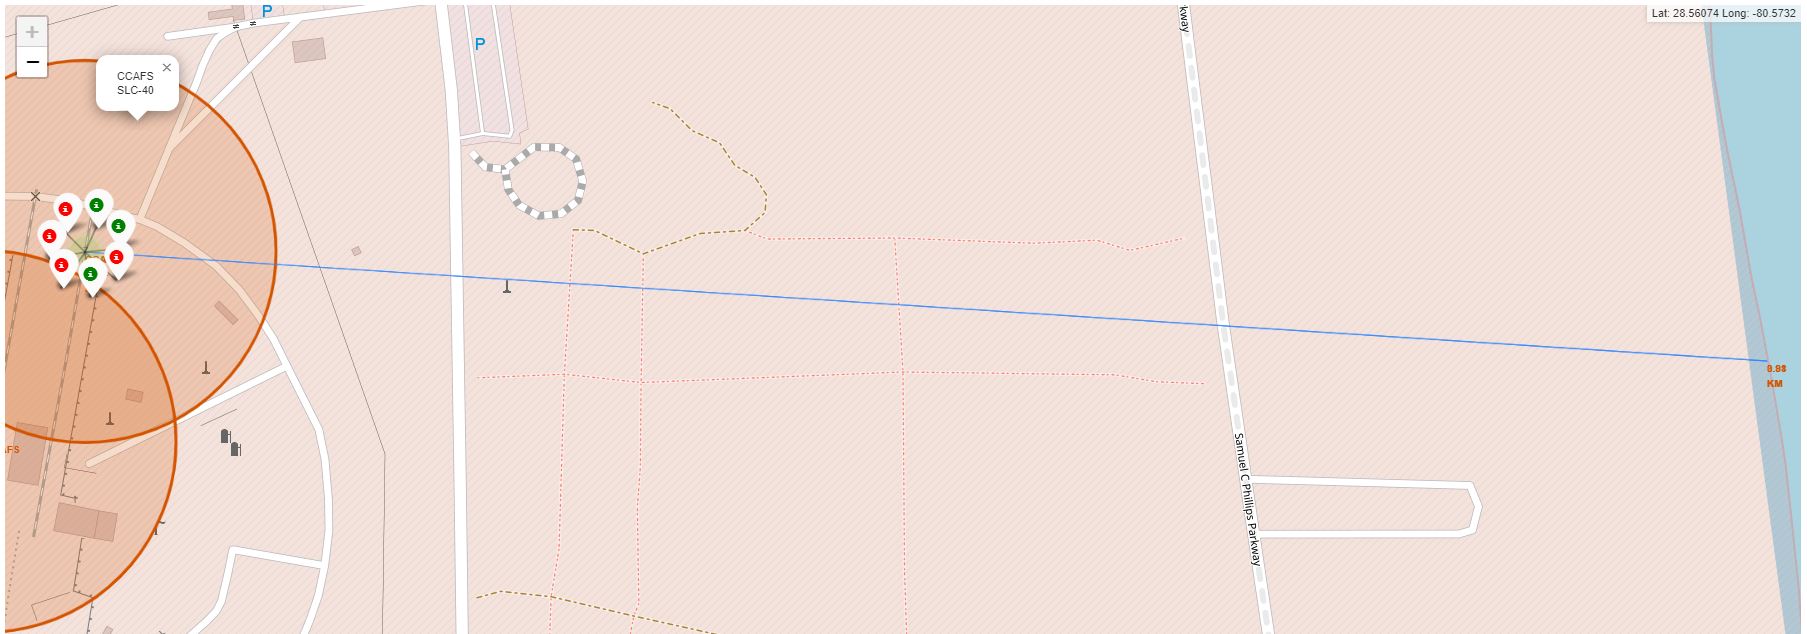
Next, we must investigate and assess the proximity of launch sites. We may begin by adding a 'MousePosition' to the map to obtain the coordinates when the mouse is over a spot. As a result, you may simply identify the coordinates of any points of significance while browsing the map (such as railway).
formatter = "function(num) {return L.Util.formatNum(num, 5);};"
mouse_position = MousePosition(
	position='topright',
	separator=' Long: ',
	empty_string='NaN',
	lng_first=False,
	num_digits=20,
	prefix='Lat:',
	lat_formatter=formatter,
	lng_formatter=formatter,)

site_map.add_child(mouse_position)
site_map
The coordinates are now displayed in the upper right corner. We may zoom in on a launch site and examine its surroundings to determine if nearby railways, roads, coastlines, etc. are conveniently accessible. We may record the coordinates of these locations and compute the distance to the launch site by dragging the mouse to these locations.
With the following function, we can determine the distance between a significant point whose coordinates we know after dragging the mouse and one of the launch sites.
from math import sin, cos, sqrt, atan2, radians

def calculate_distance(lat1, lon1, lat2, lon2):
	# approximate radius of earth in km
	R = 6373.0

	lat1 = radians(lat1)
	lon1 = radians(lon1)
	lat2 = radians(lat2)
	lon2 = radians(lon2)

	dlon = lon2 - lon1
	dlat = lat2 - lat1

	a = sin(dlat / 2)**2 + cos(lat1) * cos(lat2) * sin(dlon / 2)**2
	c = 2 * atan2(sqrt(a), sqrt(1 - a))

	distance = R * c
	return distance
By drawing a "PolyLine," we can also demonstrate the distance that exists between a defined location and the selected launch site.
coastline_CCAFSSLC40_coordinates = [[28.563197, -80.576820],[28.56268, -80.5678]]

lines=folium.PolyLine(locations=coastline_CCAFSSLC40_coordinates, weight=1)
site_map.add_child(lines)
distance = calculate_distance(coordinates[0][0], coordinates[0][1], coordinates[1][0], coordinates[1][1])
distance_circle = folium.Marker(
	[28.56268, -80.5678],
	icon=DivIcon(
		icon_size=(20,20),
		icon_anchor=(0,0),
		html='divtag style="font-size: 12; color:#d35400;"> btag %s btag divtag' % "{:10.2f} KM".format(distance),)
		# Due to the inability to insert HTML code in an HTML file, I wrote tags as statements.
	)
site_map.add_child(distance_circle)
site_map
Using folium, we may find numerous fascinating insights connected to the position of the launch sites in a very interactive way.